Lacey R F (Water Research Centre, Medmenham Laboratory, Henley
Road, Medmenham, Marlow SL7 2HD, UK) and Shaper A G. Changes in
water hardness and cardiovascular death rates. International
Journal of Epidemiology 1984, 13:
18-24.
Changes in Water Hardness and Cardiovascular Death Rates
R F LACEY* AND A G SHAPER†
* Water Research Centre, Medmenham Laboratory, Henley Road,
Medmenham, Marlow SL7 2HD, UK.
† Department of Clinical Epidemiology and General
Practice, Royal Free Hospital School of Medicine, Rowland Hill
Street, London NW3 2PF, UK.
Ten years ago Crawford, Gardner and Morris reported that
changes in cardiovascular death rates between 1951 and 1961 had
been associated with changes in the hardness of water supplies.
That study has been critically reviewed but after amendments to
method and data its overall conclusion is upheld.
New results based on changes that have taken place in water
hardness and in cardiovascular death rates between 1961 and 1971
in the county boroughs of England and Wales indicate a
significant trend for men, in the direction of decreasing
cardiovascular mortality with increasing hardness, but no trend
for women. The trend in male mortality appears to be specific to
cardiovascular disease. The results are similar to those of the
earlier study and support the hypothesis of a weak causal
relationship between the hardness of drinking water and mortality
from cardiovascular disease.
Of the many investigations into the link between
cardiovascular disease and the hardness of drinking water,
perhaps one of the most convincing has been the
‘changes’ study by Crawford, Gardner and Morris which
examined the changes in death rates that had taken place between
1951 and 1961 in the county boroughs of England and
Wales.1 Cardiovascular death rates, in general, showed
a favourable change in the towns where water had become harder
and an unfavourable change in the towns where water had become
softer. No such effect was apparent for non-cardiovascular rates.
Because these findings gave evidence suggesting a causal
relationship, they have been widely regarded as strong support
for the ‘water story’ in relation to cardiovascular
disease. Subsequent comments2,3 on the study however
suggested that the results might not be statistically significant
but did not provide the detailed reasoning for such a conclusion.
The purpose of this paper is to review the earlier study and to
present new results based on data from more recent changes in
water hardness in Great Britain. Further technical details and
comments on other studies have been given in a longer
report.4
In keeping with the original publication1 the term
‘cardiovascular’ is taken to cover all disorders of
the heart and circulation. More precisely it is defined by the
International Classification of Diseases codes 330-334, 410-468
(6th/7th Revisions) and 393-458 (8th Revision).
REVIEW OF EARLIER STUDY
Design
The study by Crawford and her colleagues was based on a
comparison between the changes in death rates three groups of
towns:
- Group A, towns which had increased their water hardness (5
towns),
- Group B, towns which had decreased their water hardness (6
towns),
- Group C, no change, control group (72 towns).
The criterion for assigning a county borough to Group A or B
was that there had been a change of at least 50 mg
CaCO3 equivalent per litre (mg 1-1 in the
total hardness of its water supply in the 30 or so years up to
1960. This definition allowed some changes that were almost
complete before the first mortality period 1948-54, while others
had only just qualified by the time of the second mortality
period, 1958-64. The grouping was therefore very unspecific with
regard to any hypothesized time lag between cause and effect
Although it would have been desirable to tighten the definition
of ‘change’ in hardness, this was probably not
possible with the data which were then available while retaining
numbers of towns in Groups A and B large enough to permit a
worthwhile statistical analysis.
Statistical Analysis
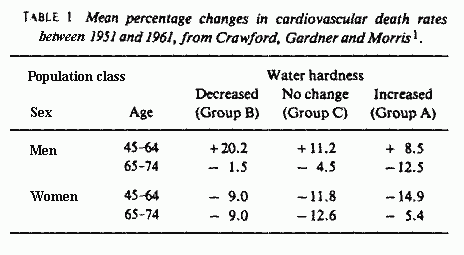
The crucial results of the earlier study are summarized in
Table 1. The differences in mean change in death rates between
groups are generally consistent with an inverse relationship
between water hardness and cardiovascular disease. The authors
claimed that the overall statistical significance of these
differences was high (p < 0.02), based on the combination of
results from the four population classes. The apparently
anomalous contrast between Groups A and C for women aged 65-74
was noted but not pursued.
The method of statistical analysis, described by Gardner, was
as follows. For each town the change in cardiovascular death rate
between 1951 and 1961 for a particular population class was
measured by the log ratio,

For each of the four population classes the effect of changing
water hardness was assessed by contrasting the mean values of y
for Groups A, B and C. These group means will be noted by
 respectively and are the basis of the results shown in Table 1.
The systematic effect of a positive change in hardness can be
judged statistically in terms of the group
differences,

For each of the four population classes the significances of
these two differences were tested using the variance of y
estimated from within the three town groups. All of this is
valid. In order to combine the eight results a further assumption
was, however, made that the changes in death rates in the four
population classes were independent.5 This assumption
does not now appear to be quite correct, as shown by the
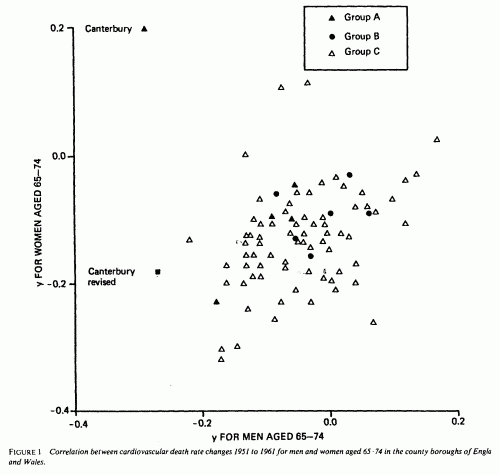
correlation coefficients in Table 2. The joint distribution of
changes in death rates for the two most highly correlated classes
is illustrated in Figure 1.
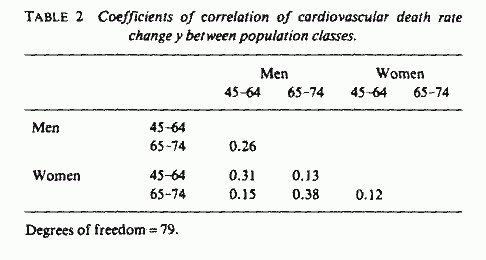
Although the correlations between age-sex classes were not
very strong, they are not negligible. Making allowance for all of
these positive correlations in testing the sum of the eight
contrasts would have the effect of increasing the critical
probability to about 0.06, a more equivocal result than the 0.02
that was reported.
The Canterbury Tale
From Figure 1 it is apparent that in Canterbury, one of the
towns which had experienced an increase in water hardness, there
was an exceptional combination of death rate changes, with the
largest death rate decrease for men but the largest increase for
women. This behaviour seemed suspect, particularly as it could
help to account for the anomaly earlier noted for the older women
in town Group A (Table 1). The Canterbury data were therefore
checked for clerical or arithmetical errors, but none were found.
An investigation of the population structure in Canterbury in
1951 and 1961, however, indicated that there had been an
unusually large influx of women born before 1900, and this
suggested that institutional populations might be involved.
Information kindly supplied by the Kent Area Health Authority
pointed to St Martin’s, a psychiatric hospital which had
changed from having about 30 male beds and no female beds in 1951
to 200 female beds and no male beds in 1961. The records for this
hospital during 1958-64 were still in existence, and during that
period there had been 64 cardiovascular deaths of women aged
65-74, which was one-third of the number for the whole of
Canterbury. Of the 64 patients, only four had previously been
resident in Canterbury itself. These findings justify an
amendment to the mortality data for Canterbury, shown in Figure
1. The numerical outcome is to alter the estimate for women aged
65-74 in Group A in Table 1 from -5.4 to -12.2.
Re-assessment
Retaining the original grouping of towns (A, B and C), the
numbers of towns in Groups A and B are roughly balanced. If the
effect of water hardness on cardiovascular disease is believed to
be reversible then a powerful straightforward test of the water
hardness effect in this design of study is to examine the
contrast  . The value of this
contrast, multiplied by 100, is approximately interpretable as
the average difference in the per cent change in cardiovascular
mortality, between Groups A and B. The results are presented in
this way in Table 3, which includes the amendment of data for
Canterbury. The method used here for combining results from
different age-sex classes is simply to average the respective
y’s, but the positive correlations between classes have
been taken into account in formulating the standard errors of the
combined results.
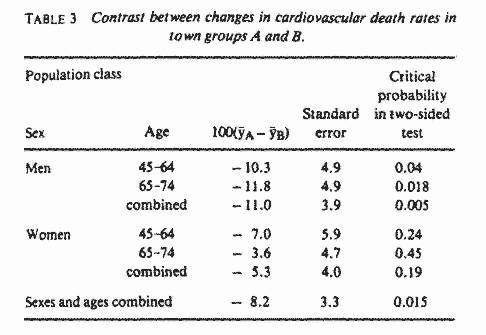
The hardness-related effect is significant for men but not for
women, although it is of the same sign. While it appears that
there might be a difference between the size of effect for men
and women, the difference is not significant and so an overall
average can be estimated if desired. This overall average is
significantly different from zero, at a significance level almost
identical to that originally claimed. The amendment of the data
for Canterbury thus improves the consistency of the results to an
extent which just outweighs the weakening effect of allowing for
the inter-class correlations. The conclusion of Crawford, Gardner
and Morris can therefore be upheld, provided that one accepts the
criteria for water hardness changes on which it is based.
MORE RECENT CHANGES
Data and Methods
Since 1960 there have been changes in the water supplies to a
number of the county boroughs. An investigation of the
corresponding changes in death rates has been based on population
numbers from the Censuses of 1961 and 1971 and numbers of deaths
for the periods 1958-64 and 1969-73 respectively. This
investigation followed broadly the design of the earlier study
but with several modifications. The evolution of the method from
that used in the earlier research has been described elsewhere
but its principal features are as follows.
(i) Same cohorts
One possible disadvantage of analysing intercensal changes
in mortality rates for a fixed age group, say 45 to 64 years,
is that the actual membership of the population class whose
health is being measured also changes. A way round this is to
base the analysis of changes in death rates not on fixed age
groups, but on cohorts whose membership would remain
constant, apart from geographical migration or death. The
most convenient cohorts for use in this study were those of
men and women who were between 45 and 64 years old around
1961 and who became between 55 and 74 years old around 1971.
Although cardiovascular death rates increase with age, the
question can be put whether they have increased faster or
slower in towns which have changed their water hardness than
in ones which have not. In order to analyse this, y was
redefined, for each county borough and for men and women
separately, to be the logarithm of the proportional increase
in death rate of the relevant cohort between 1961 and 1971
or, equivalently,

(ii) Timing of changes in water hardness
In order to be more precise about timing, the changes in
water hardness were assessed over the same time interval as
the changes in mortality rates. The following analyses are
therefore testing for a response which happens
instantaneously or within a year or two of the change in
water, and not one which lags by more than a decade.
(iii) Sizes of changes in water hardness
For each of the county boroughs information was collected
from a number of sources to try to ascertain what the
hardness had been in 1961 and 1971 (using five-year means
where possible). In the earlier study, because of lack of
precision of timing, it was sensible to describe the sizes of
changes in a categorical way by grouping the towns. For the
more recent data it is however possible to represent the
sizes of water hardness changes on a continuous scale and to
take this into account in comparing the values of y for towns
which have changed their hardnesses by different amounts.
The method of quantifying the changes in water hardness
depends on the exact form of hypothesis to be tested. In this
work we were particularly interested in the extent to which
the response to changes in water hardness might confirm the
results of the latest large-scale geographical
analysis.6,7 That research suggested that the
effect of water hardness might be non-linear with greater
potency in the range up to 170 mg 1-1. For each
town the ‘effective size of change’ was therefore
defined as the extent of change within the hardness range 0
to 170 mg 1-l.
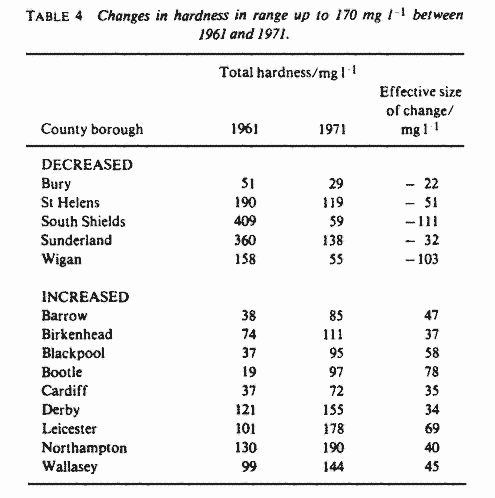
Between 1961 and 1971 substantial changes in this range
took place in 14 county boroughs whose data are shown in
Table 4. This table includes all those county boroughs for
which the effective size of change exceeded 20 mg
1-1 Most are well above that threshold. Of the
further 62 county boroughs available for this study some nine
had changed hardness by between 10 and 20 mg 1-1,
the remaining 53 by less than 10 mg 1-1. These 62
were assigned the same plotting position as of zero change.
Canterbury and those county boroughs which were newly
constituted or re-constituted with different boundaries
between 1961 and 1971 have been omitted.
(iv) Statistical method
The method of statistical analysis was linear regression
of y, the logarithm of death rate increase, on x, the
effective size of change of hardness. For ease of
interpretation the regression slope b is tabulated as
104b which is approximately equal to 100
(exp(100b)-1), the per cent change in death rate associated
with an increase of hardness of 100 mg 1-1 in the
hardness range below 170 mg 1-1.
(v) Social factors
The possibility of socioeconomic conditions influencing
the relative changes in death rates in different towns was
checked by introducing two of the factors that had appeared
significant in the British Regional Heart
Study.6,7 These were ‘% manual
workers’ and ‘% unemployed’. The values of
these were available for each county borough for 1961 and for
1971 so that either their absolute levels or their changes
could be used as covariates.
Results
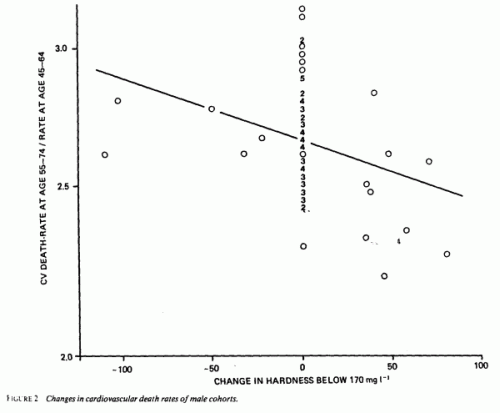
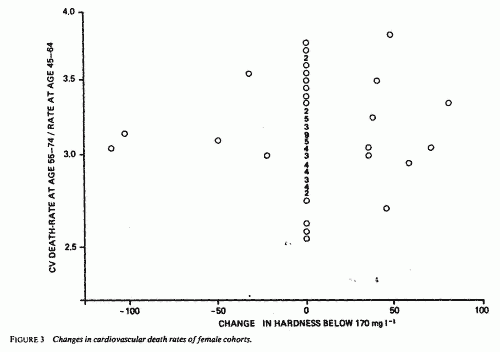
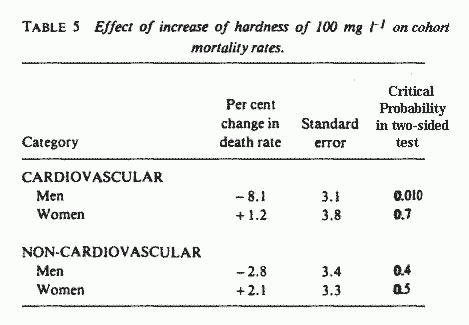
The changes in cardiovascular death rates for the male and
female cohorts are shown in Figures 2 and 3 and the results for
cardiovascular and non-cardiovascular deaths are summarized in
Table 5. For changes in cardiovascular mortality of the male
cohorts, the trend in the direction predicted by the ‘water
story’ is statistically significant. For the female cohorts
there is no detectable effect, nor is there for
non-cardiovascular mortality for men or women. The contrast
between the -8.1% for men and the 1.2% for women is statistically
significant (p=0.019). Although the results in Table 5 suggest
that the effect of water hardness is specific to cardiovascular
disease, the outcome of a formal test contrasting the -8.1% with
the -2.8 is unconvincing (p=0.21).
The above results were modified only slightly by the
introduction of the social factors. None of the correlations
between y and ‘% manual’ or ‘%
unemployed’ were significant at the 5% level. The largest
size of correlation coefficient, that between male cardiovascular
y and ‘% unemployed’ in 1961, was -0.22. which was in
reverse of the expected direction. There was however a slight
tendency for the towns whose hardness increased to contain fewer
than average manual workers (r=-0.18) and a slight tendency for
‘% manual’ in 1961 to be associated with high
increases in cohort mortality (r=+0.18). When adjustment was made
for this, the regression coefficient for cardiovascular deaths in
men (Table 5) became -7.5 and its significance was corresponding
somewhat lower (p=0.020). These results however do more to
confirm than detract from the previous findings.
DISCUSSION
Although this paper has underlined the reservations about the
criteria for changes in hardness used in the study by Crawford,
Gardner and Morris,1 the results of re-analysing their
data and the results of the more recent work are remarkably
similar. Both sets of results show a significant effect for men,
in the direction consistent with an inverse relationship between
water hardness and cardiovascular mortality but no effect for
women. This difference between the sexes does not appear to be
fortuitous, particularly in the 1961-71 analysis.
It is of interest to compare the size of effect emerging from
this work with that suggested from the results of Phase I of the
Regional Heart Study.6,7 In that study a difference of
one standard deviation in water hardness (109 mg 1-1),
occurring in the hardness range up to 170 mg 1-1, was
associated with a difference of 7 in SMR for all cardiovascular
disease. In the present study an increase in water hardness of
100 mg 1-1 in that range was estimated to decrease
male cohort mortality by about 8%. These estimates of size of
effect are well within the bounds of statistical agreement. In
the Regional Heart Study men and women showed similar
relationships between water hardness and cardiovascular mortality
and to that extent the results of the Regional Heart Study and
the present analysis do not agree.
The importance to be attached to the results of this study
depends on the extent to which a natural experiment can be
regarded as if it were a controlled experiment. One aspect
outside of our control was the allocation of hardness changes to
towns, and in the new data six of the change towns occur in
geographically adjacent pairs. The interpretation rests on the
assumption that factors other than water quality are not
seriously confounded with the changes shown in Table 4. This
assumption has been checked for the two most obvious
socioeconomic variables and found to hold, but there may be other
factors operating and the safeguard against this cannot be
complete.
All conclusions based on this study need to recognize that the
design and the method of analysis are relatively crude. On the
whole the findings add some support to the idea that the
association between cardiovascular disease and the hardness of
drinking water is real and causal. The size of the effect appears
however to be rather small and neither from this nor from other
epidemiological work has it been possible to identify the
specific water constituent that is responsible.
ACKNOWLEDGEMENTS
We are grateful to Mr W A Stovell of the Kent Area Health
Authority for investigating the hospital data for Canterbury.
The work at the Water Research Centre (RFL) was carried out
under contracts to the Department of the Environment and the
Commission of the European Communities (CEC Contract 246-77-1 ENV
UK), whose permissions to publish have been given. The Regional
Heart Study (AGS) is supported by a programme grant from the
Medical Research Council.
REFERENCES
1 Crawford M D, Gardner M J and Morris J N. Changes in water
hardness and local death-rates. The Lancet 1971;
2: 327-9.
2 Clayton D G. Water hardness and cardiovascular mortality in
England and Wales. In: Amavis R, Hunter W J and Smeets J G M P
(eds) Hardness
of Drinking Water and Public Health: 323-340, Pergamon,
Oxford, 1975.
3* Shaper A G. Water hardness and cardiovascular mortality. In
Drinking Water Quality and Public Health: 19-38, Water Research
Centre, Medmenham, 1976.
4* Lacey R F. Changes in Water Hardness and Cardiovascular
Death rates. Technical Report TR 171. Water Research
Centre, Medmenham, 1981.
5 Gardner M J. Using the environment to explain and predict
mortality. Journal of the Royal Statistical Society,
Series A 1973; 136(3):421-40.
6 Pocock S J, Shaper A G, Cook D G, Packham R F, Lacey R F,
Powell P and Russell P F. British Regional Heart Study:
Geographic variations in cardiovascular mortality, and the role
of water quality. British Medical Journal 1980;
2(280): 1243-9.
7 Pocock S J, Cook D G and Shaper A G. Analysing geographic
variation in cardiovascular mortality: methods and results.
Journal of the Royal Statistical Society, Series
A, 1983; 145(3): 313-41.
*References 3 and 4 are obtainable from the Water Research
Center
(Revised version received February 1983)
This page was first uploaded to The Magnesium Web Site on
September 20, 2002
http://www.mgwater.com/


